 GeoCalendar
Open Analytics. Choose the Date range (the last 7, 30 or 90 days) and whose bookings to count: yours, everyone’s, or one teammate’s.
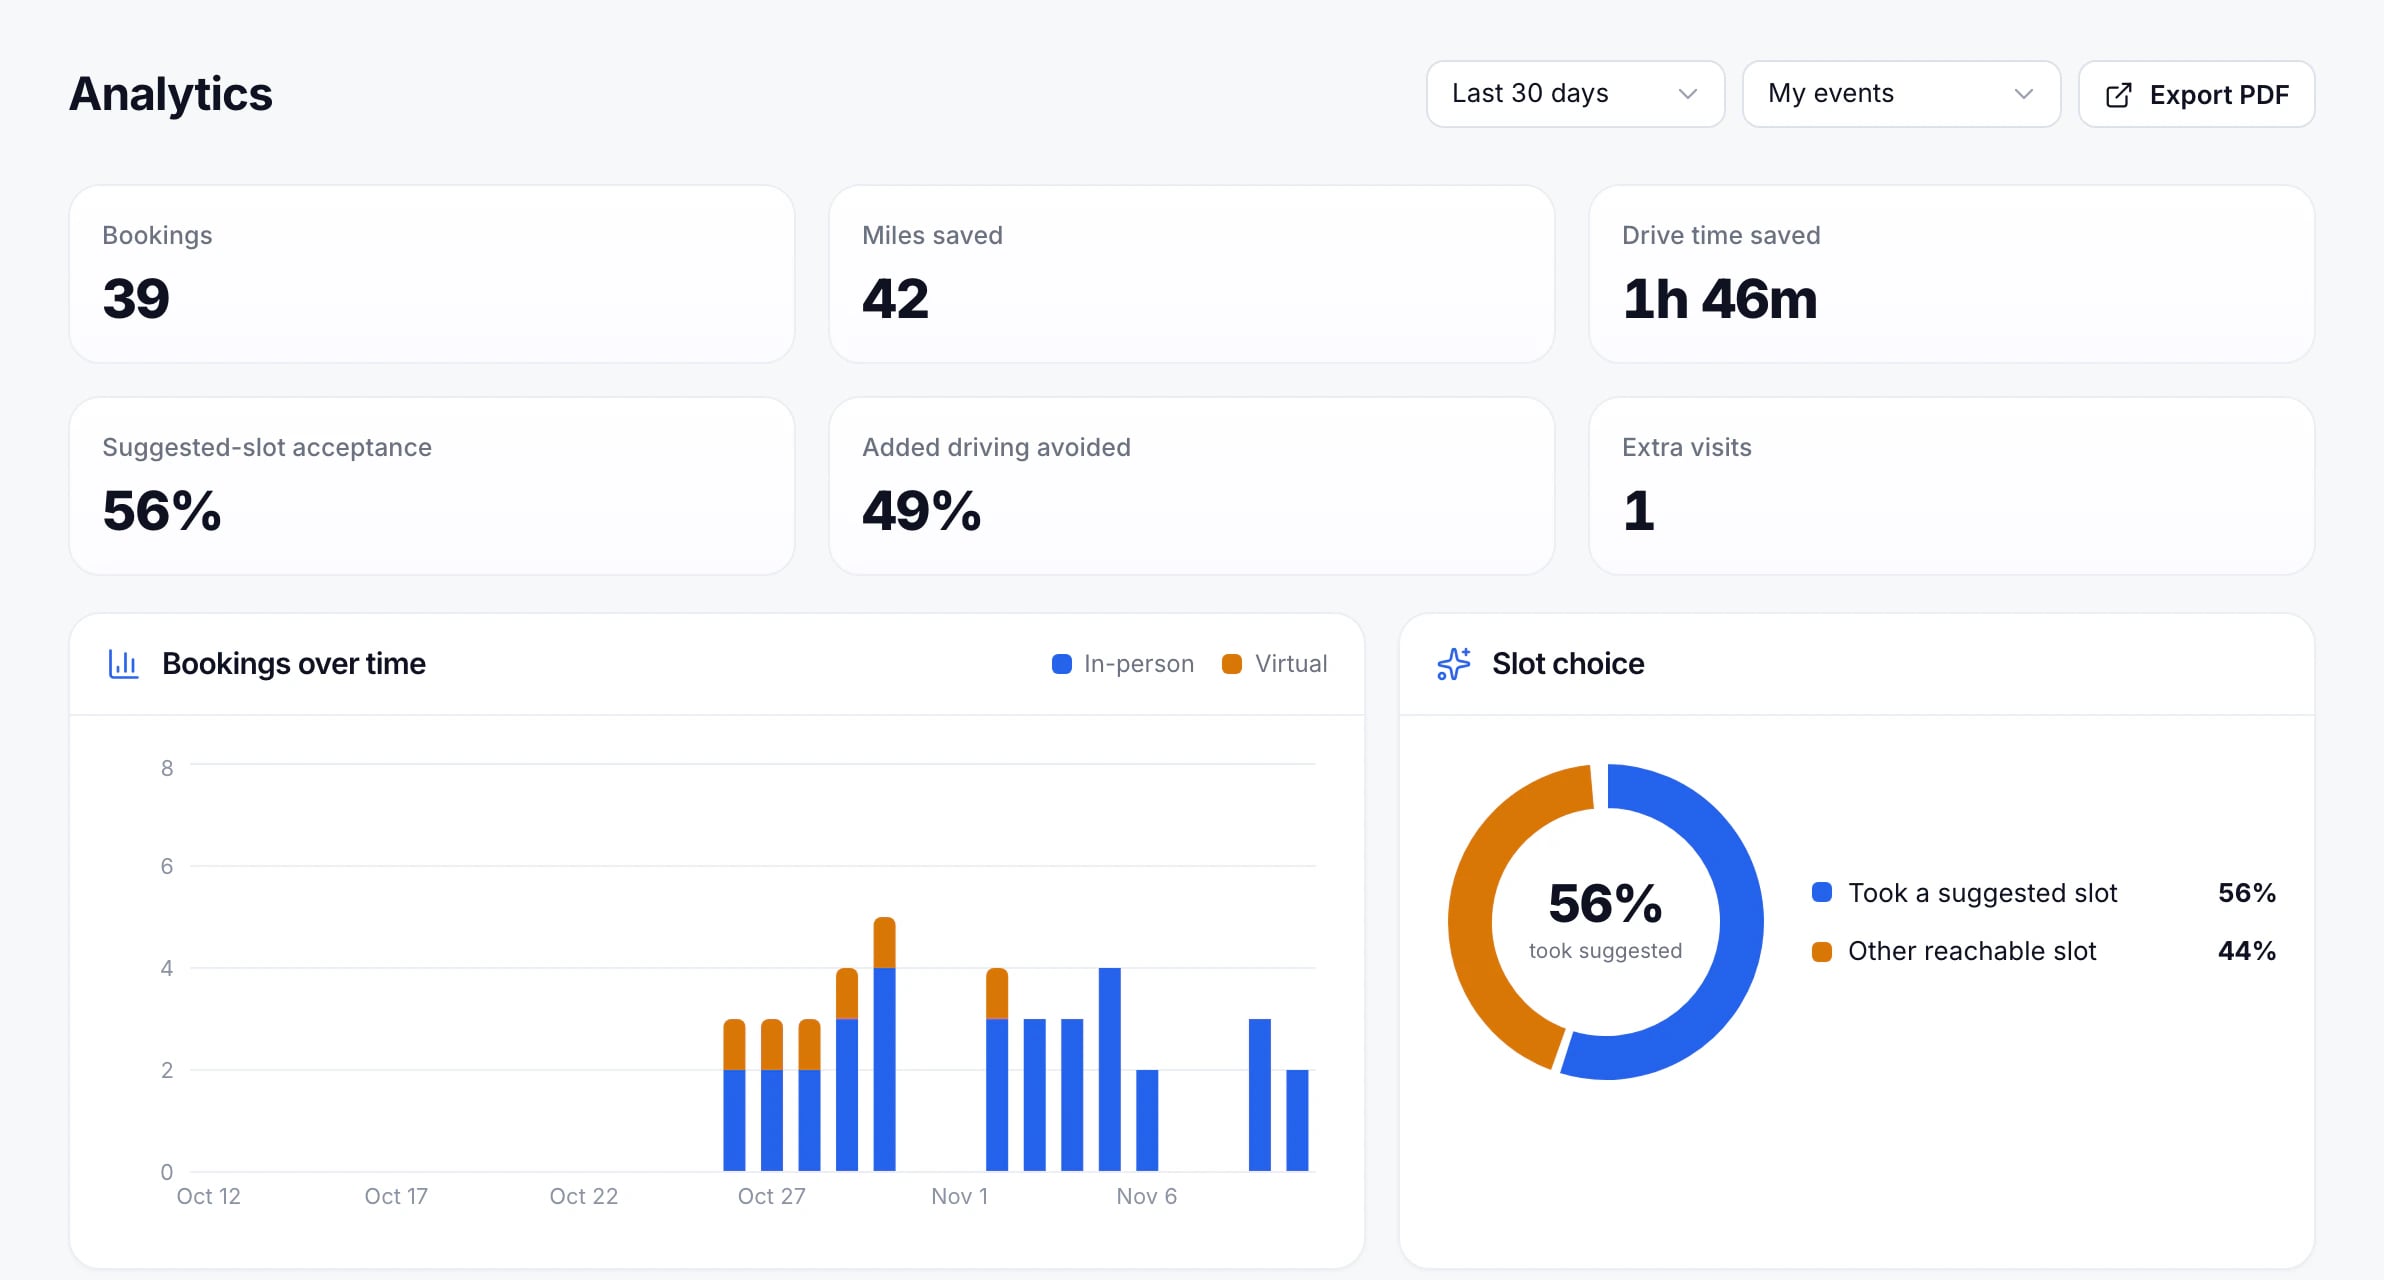
What it shows
- Bookings, and how they compare with the period before.
- Drive time saved: driving avoided compared with booking without suggestions. An estimate.
- Suggested-slot acceptance: the share of in-person bookings that took a suggested time.
- Added driving avoided: how much of what the next best times would have added was saved.
- Extra visits: what the saved driving is worth in visits.
- Charts of bookings over time, the booking funnel, when customers book, and each event type’s bookings and conversion.
The driving figures fill in once bookings have come through the booking page with Smart Suggestions on.
Share it
Export PDF downloads the page as you see it as a PDF, to send or print.
Updated November 10, 2026
Learn moreAnalytics